Kartoza - How to Create a Point Distance Marker Layer Along a Line in PostGIS
This is part 1 of a 3-part series.
This is part 1 of a 3-part series.
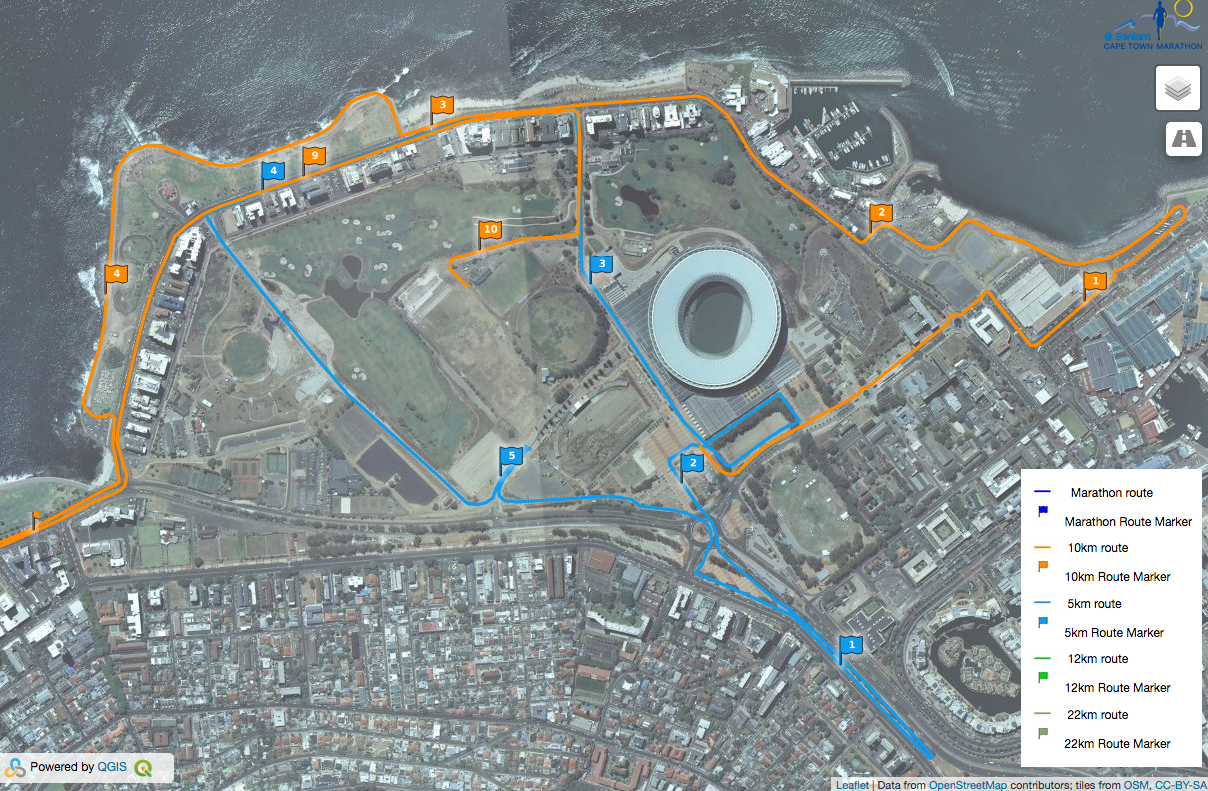
If you look at the Cape Town Marathon interactive web map you'll see kilometre markers along the race routes. Creating these is not as straighforward as you might think. For the team planning the marathon and the other routes, it used to involve a painstaking manual process in Google Earth.
- The routes are edited fairly often leading up to the event
- They don't want to manually create points each time they edit the route
- They need the distances to be as accurate as possible. After all, the Marathon is an IAAF Gold event. However, even the best map won't have 100% accurate distance because of mapping errors and elevation changes. To establish the official finish line position, a cyclist measures the route along the path a runner would take. That's why the end distance markers aren't exactly at the end of the route.
I had my eye on a solution involving linear referencing from the start and tried a couple of approaches before settling on the one I describe in detail below. I did find solutions using v.segment from GRASS and the QGIS LRS plugin but I felt these were too complex for a non-GIS specialist and they also involve several steps.
My final solution was a view in PostGIS that just sits there untended on the server and generates the points automatically every time someone views the web map. The planners can edit the routes without worrying about the markers. When they save a route update, the markers just work.
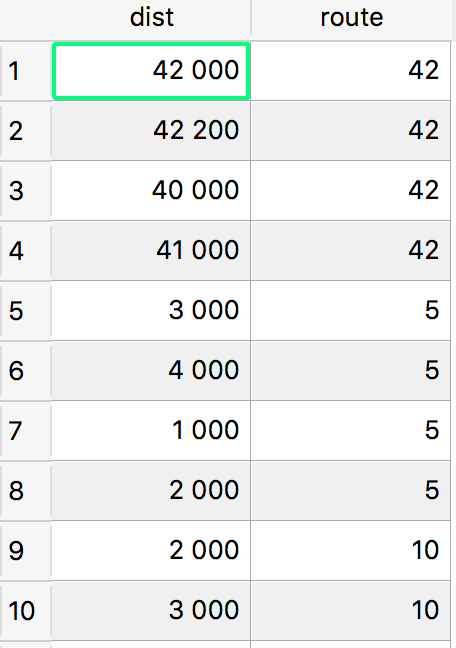
I first created an event table with the ids of the routes and the distances at which I wanted markers. This is a sample:
Then because we're working in the local CRS for Cape Town, which does not come standard in GIS software, I had to add the the WGS19 CRS (called 'HBK_NO19' in QGIS) to PostGIS by running this query, giving it the arbitrary id of 40019:
INSERT INTO spatial_ref_sys (srid,proj4text)
VALUES (40019,'+proj=tmerc +lat_0=0 +lon_0=19 +k=1 +x_0=0 +y_0=0 +axis=enu +ellps=WGS84 +towgs84=0,0,0,0,0,0,0 +units=m +no_defs');
I then created a view like this for each route.
CREATE OR REPLACE VIEW markers_marathon AS
WITH m19 AS
    (SELECT ST_Transform(m.geom,40019) AS geom, mm.dist, ST_Length(geom::geography) AS length
     FROM marathon m
     JOIN marker_events mm
     ON m.route_id = mm.route)
SELECT row_number() over()::int4 AS id, ST_Lineinterpolatepoint(geom,dist/length) AS geom,
    CASE WHEN round(dist/1000.0,1)::character varying LIKE '%.0' THEN (dist/1000) ELSE round(dist/1000.0,1) END AS dist
    FROM m19
    WHERE dist <= length;
The WITH subquery prepares a table that has the route in each row projected to the local CRS, along with the marker distance from the event table and the length of the route (very accurately calculated on the spheroid and taking into account elevation changes, since the geometry has Z values).
The main part of the query then interpolates a point along the route at each marker distance and does some formatting of the distance so it can be used as a label in the map. It also filters out any marker that might go beyond the length of the route (which would be meaningless to interpolate and would cause the query to fail).
I had to project the routes because they are stored unprojected (EPSG:4326) and I wanted to minimise distortion for the linear referencing, which operates only on geometries and not geographies. You'll notice the ST_Length() was done with a geography, which is a PostGIS type that forces functions applied to it to operate on the WGS84 spheroid rather than on a plane. A length calculated on the spheroid is more accurate than a length calculated in any planar projection and is further enhanced if there are Z values in the coordinates (ST_Length() on a 3D geography returns a 3D length).
If you have an elegant solution to the same problem I'd love to know about it... Using generate_series() like this instead of joining to an event table is pretty elegant.
Extra note:
How come there are just a few markers when zoomed out and then one every km when zoomed in? We did this with rule-based rendering in QGIS with scale dependency in each rule and this filter in the 'zoomed out rule': dist % 2 = 0, which filters out everything that has a remainder when divided by two (or five in the case of the marathon).
See Part 2: Adding elevation to a line from a DEM in PostGIS and maintaining accurate measures


No comments yet. Login to start a new discussion Start a new discussion